OUR SERVICES
WHY FANGORN?
OUR METHODS
PARTNER WITH US
Services
We provide tailored solutions to commercial and research organisations of all shapes and sizes.
Estimate carbon stock
We offer a unique, site specific approach to woodland carbon stock. With estimates for each tree in your forest.
Acquire data
Looking for a standard LiDAR or hyperspectral survey? We provide the best rates to start-ups and other research organisations.
Assess tree health
In development
Fangorn is creating the UK's largest database of tree health indicators to identify and prevent the spread of diseases such as Ash dieback.
Why Fangorn?
We are here to improve carbon accounting for nature based solutions and provide cost-effective solutions for sustainable land management.
AccuraTE
Our proprietary models are up to 50% more accurate than traditional methods at estimating existing carbon stocks.
A high degree of automation (subject to human review) results in more consistent and repeatable outcomes.
Auditable
We create digital twins of every site, this allows us to update our estimates for the latest advances in technology.
Each stage of data interpretation is open to review, simplifying checks by external parties and aiding compliance efforts.
Actionable
Highlight individual trees or entire forest stands, allowing detailed insights for areas of all sizes from 1-1,000+Ha.
We deliver reports tailored to our clients needs and can deliver data directly into your platforms or processes.
Affordable
Automated techniques handle larger areas more efficiently, helping manage both time and budget constraints.
We work with organizations of all shapes and sizes and want to ensure equitable access to the latest advances.
Methodology
We apply the latest in technological advances to deploy highly accurate models, using a combination of publicly available research and our proprietary databases and methods.
1
Capturing the canopy

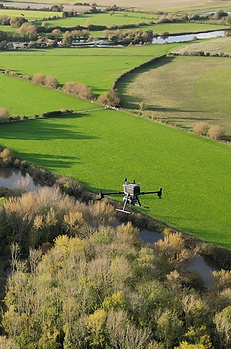
We begin by collecting a rich tapestry of forest data using LiDAR, optical, hyperspectral, and terrestrial laser scanning (TLS) technologies. Each sensor reveals a different aspect of the forest—heights, densities, spectral signatures—giving us a comprehensive 3D view of every stand and tree.
3
Calculating carbon

With both tree morphology and species identified, we derive wood density and moisture content estimates. These parameters, combined with the modeled wood volume, yield an accurate biomass figure. Finally, we convert biomass to carbon, taking moisture into account to reflect real-world conditions.
2
Modelling wood volume

Next, we segment and isolate individual trees from the LiDAR data, then apply quantitative structure modeling (QSM) to reconstruct each trunk and branch. This process translates raw sensor readings into precise estimates of wood volume for every tree in the forest.
4
Identifying tree species

By blending hyperspectral insights with the structural data gathered from QSM, we predict the species of each tree. Subtle differences in foliage color, reflectance, and branching patterns guide our algorithms toward accurate classification—even for trees that may look similar to the naked eye.
5

Every data point is georeferenced, attaching high-resolution measurements to individual trees. From single-tree metrics to expansive project-level overviews, these localized insights drive more informed decision-making, forest management, and sustainability initiatives.
Delivering insights